
30 Year Mortgage Principal and Interest Chart Explained: The Shocking Truth You Won’t See on
When you sign a 30-year mortgage, you're not just borrowing money – you're entering a financial marathon where visual intelligence is your greatest ally. The 30-year mortgage principal and interest chart (amortization schedule) reveals what your eyes can't see in monthly statements. Here's how to read this financial roadmap:
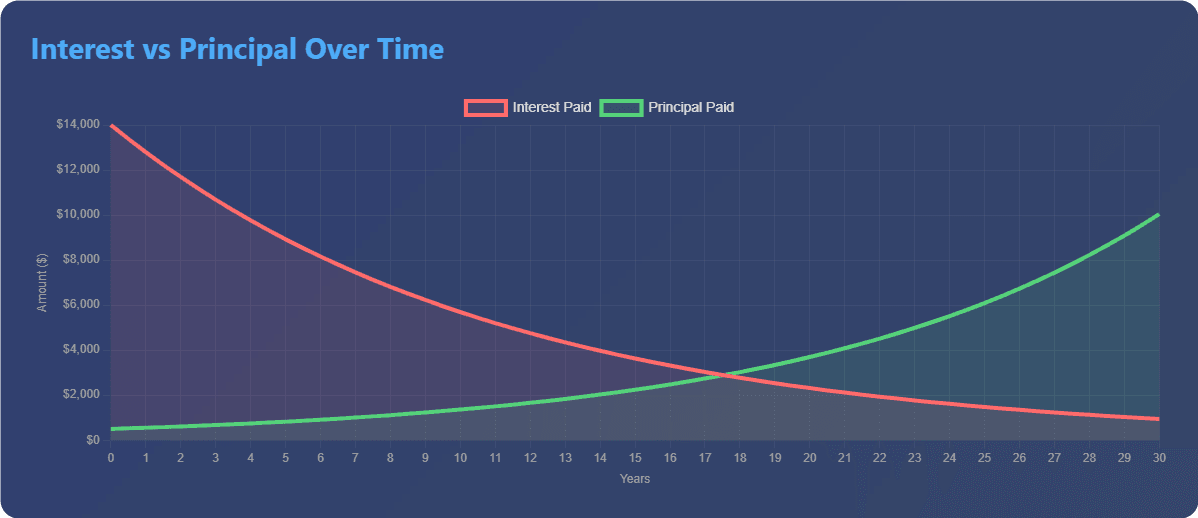
1. The Amortization Curve: Your Mortgage's DNA
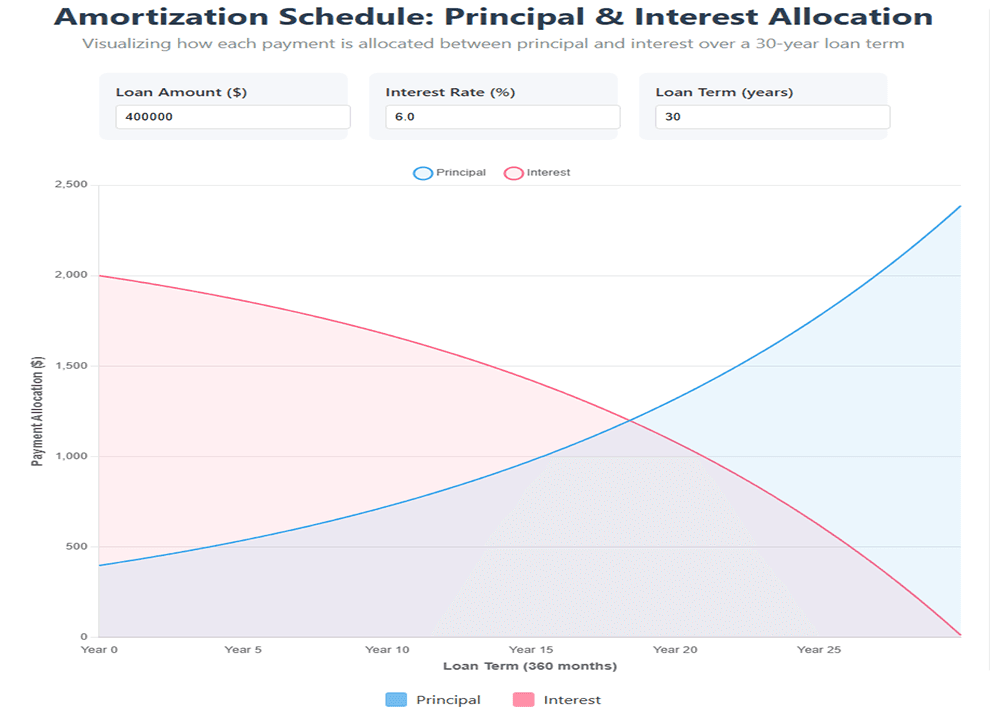
- Interest Domination (Years 1–10): Red towers over blue, consuming 70–85% of early payments. At Year 5, you've barely chipped away 12–15% of principal on a $500k loan.
- The Crossover Point (Year 15–18): Where cumulative principal paid finally exceeds interest – your financial breakeven moment.
- Equity Acceleration (Year 20+): Principal payments spike as interest shrinks – wealth building enters hyperdrive.
- The Silent Killer: That tiny "Total Interest" footnote? For a $400k loan at 6%, it reads $463,353 – more than the house itself!
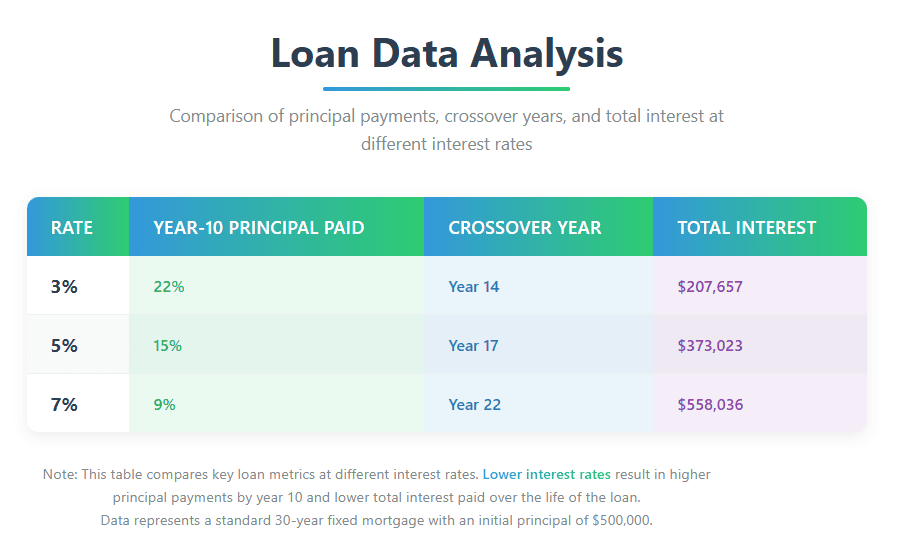
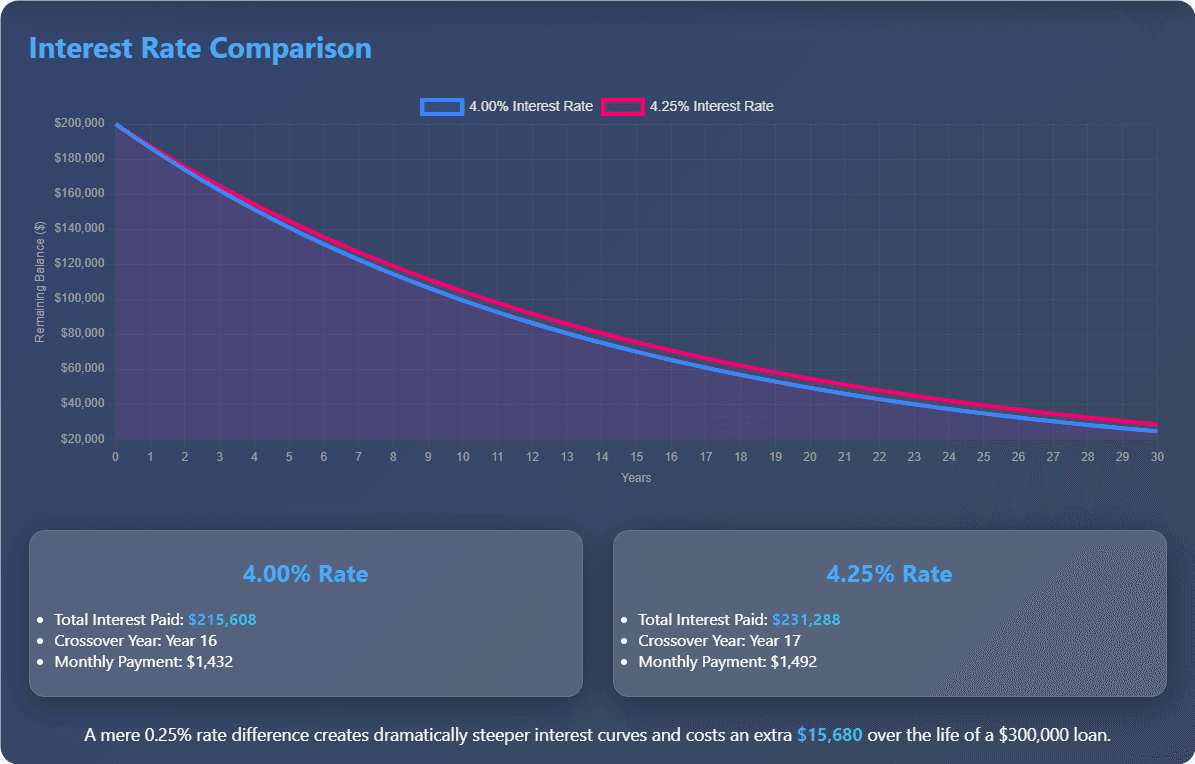
2. Interest Rates: The Curve Manipulator
3. Strategic Moves: Rewriting Your Curve
A. The Early Payoff Power Play
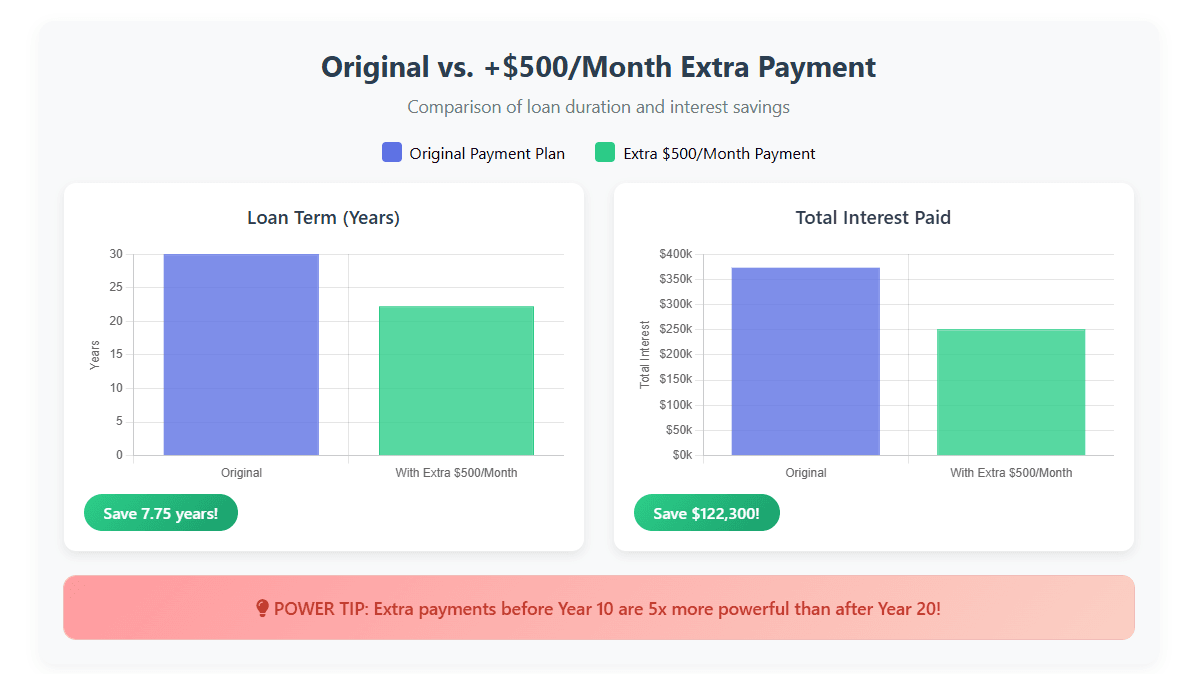
At 5% on $400k loan:
- Years Saved: 7.75 years
- Interest Saved: $122,300
- Secret: Extra payments before Year 10 are 5x more powerful than after Year 20.
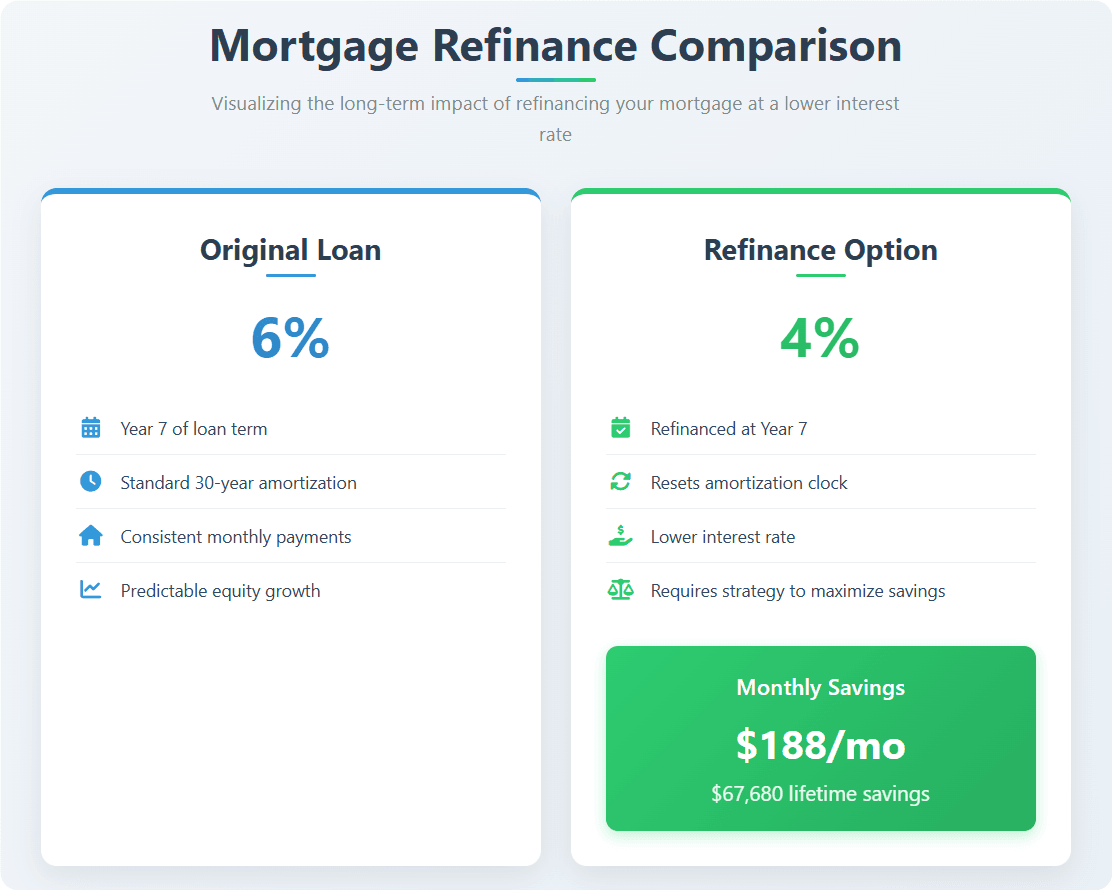
B. Refinancing: The Double-Edged Sword
-
Win: Saves $188/mo → $67,680 lifetime savings
-
Risk: Resets amortization clock – unless you:
- Keep original payment schedule
- Choose shorter loan term
4. Mortgage Myths Busted by Your Chart

The Homeowner's Edge: Chart-Powered Tactics
- Demand your 30-year mortgage principal and interest chart from lenders – it's your legal right
- Run "what-if" scenarios before major decisions:
- Extra payments
- Refinancing
- Loan recasting
- Monitor your crossover year – plan major financial moves around it
- Compare loans visually – a 0.25% rate difference creates dramatically steeper interest curves
Most homeowners stare at monthly payments while wealth builders analyze amortization curves. The difference? Six figures in savings.
Final Insight:
That red interest curve isn't just bank profit – it's your lost investment returns. Every dollar saved on interest through strategic prepayments could compound to $7.34 in 30 years (at 7% market returns). Your 30-year mortgage principal and interest chart isn't a boring spreadsheet – it's the X-ray revealing your financial skeleton. Read it wisely, and you'll transform from debt carrier to wealth architect.
People Also Read